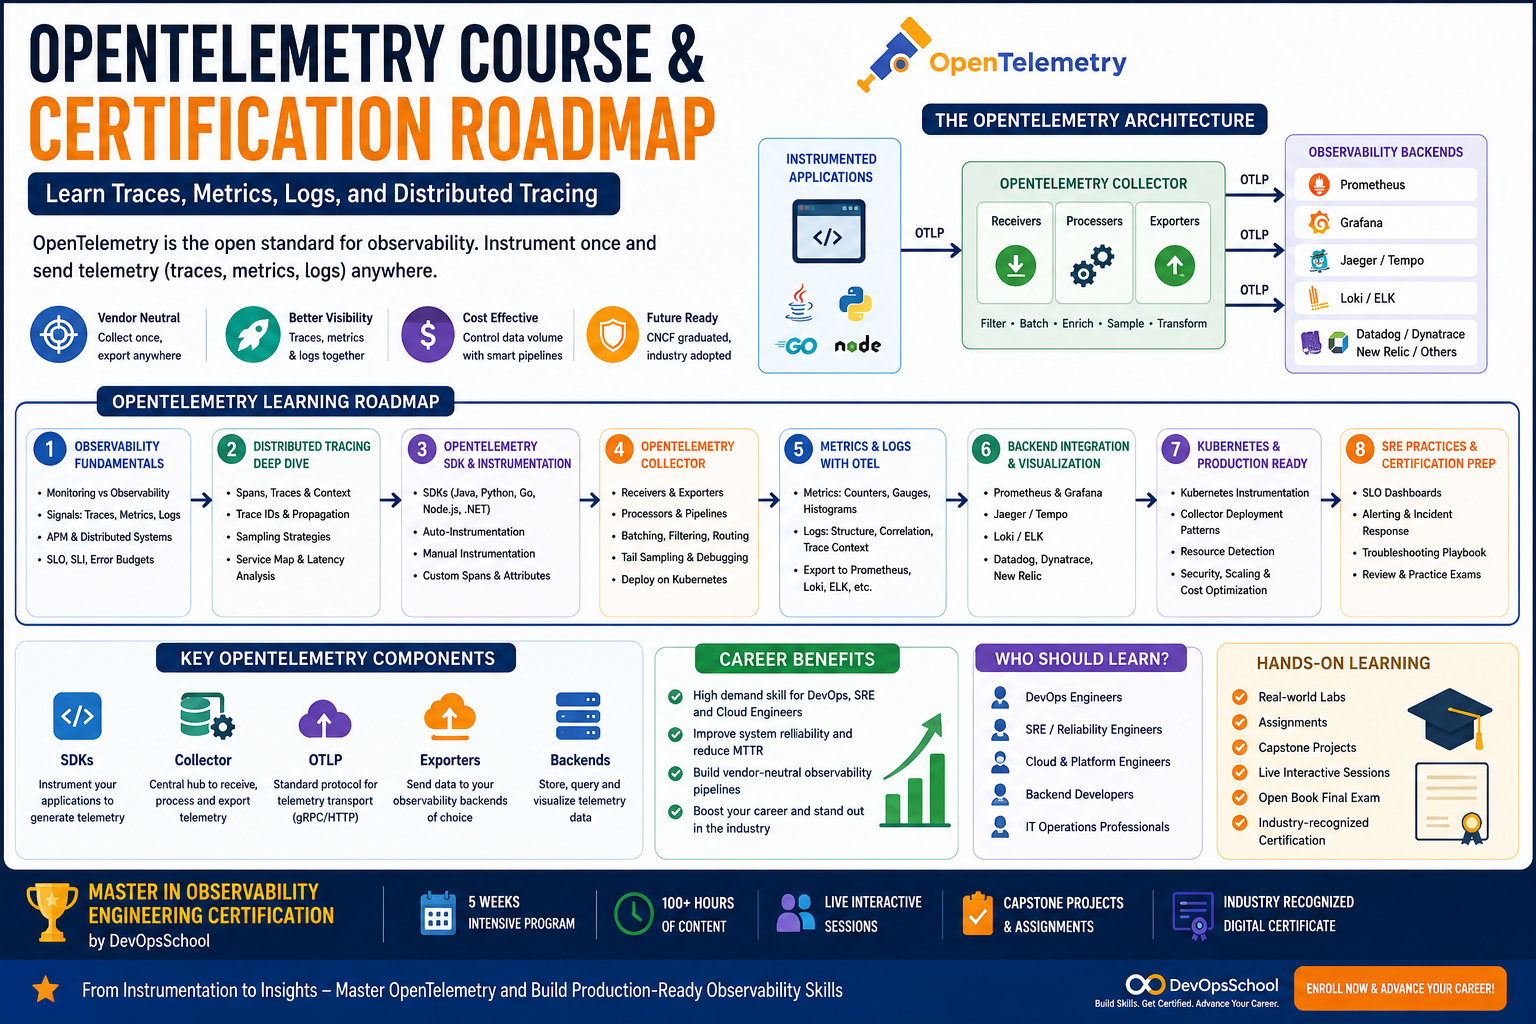
OpenTelemetry is no longer a “nice-to-know” tool for modern engineers.
It has become one of the most important skills for anyone working with DevOps, SRE, cloud-native platforms, Kubernetes, microservices, application performance monitoring, and production reliability.
A few years ago, most teams instrumented applications separately for each monitoring or APM tool. One agent for traces. One library for metrics. Another integration for logs. Another exporter for dashboards. Another vendor-specific SDK for performance monitoring.
That model created complexity, vendor lock-in, duplicated effort, and inconsistent telemetry.
OpenTelemetry changed the conversation.
It gives engineering teams a standard way to generate, collect, process, and export telemetry data such as traces, metrics, and logs. Instead of tying your application directly to one observability vendor, OpenTelemetry allows you to instrument once and send telemetry to many backends, including Prometheus, Grafana, Jaeger, Tempo, Datadog, Dynatrace, New Relic, Elasticsearch, and other observability platforms.
For beginners, OpenTelemetry can look intimidating at first.
There are SDKs, APIs, Collectors, receivers, processors, exporters, context propagation, spans, resources, semantic conventions, OTLP, auto-instrumentation, manual instrumentation, metrics pipelines, logs pipelines, traces pipelines, and Kubernetes deployment patterns.
But once you understand the roadmap, OpenTelemetry becomes much easier.
This guide explains how to learn OpenTelemetry step by step, what to study first, how traces, metrics, logs, and distributed tracing fit together, how certification helps, and why DevOpsSchool’s Master in Observability Engineering Certification is a strong fit for learners who want hands-on OpenTelemetry training as part of a complete observability engineering path.
What Is OpenTelemetry?
OpenTelemetry, often called OTel, is an open-source observability framework used to instrument applications and collect telemetry data.
Telemetry data usually includes:
- Traces
- Metrics
- Logs
In simple words, OpenTelemetry helps your systems explain what they are doing.
It helps answer questions like:
- Where did this request go?
- Which service caused the delay?
- Why did this transaction fail?
- How long did each dependency take?
- Which endpoint has the highest latency?
- What errors happened during this trace?
- Which service is producing abnormal metrics?
- Are logs, metrics, and traces connected?
OpenTelemetry is especially important in distributed systems. In a monolithic application, one request may stay inside one codebase. In a microservices architecture, one request may travel through ten or twenty services before returning a response.
Without OpenTelemetry or distributed tracing, understanding that journey becomes painful.
With OpenTelemetry, you can instrument your application, collect traces, capture metrics, correlate logs, and send that data to observability tools where engineers can debug real production problems.
Why OpenTelemetry Matters for DevOps and SRE Engineers
DevOps and SRE teams are responsible for production confidence.
DevOps teams care about deployment, automation, infrastructure, cloud systems, CI/CD, Kubernetes, and platform operations.
SRE teams care about reliability, SLOs, error budgets, incident response, service health, performance, and user impact.
OpenTelemetry helps both teams because it provides a consistent telemetry layer across applications and infrastructure.
For DevOps engineers, OpenTelemetry helps answer:
- Did the latest deployment increase latency?
- Are application metrics being collected correctly?
- Are services sending telemetry to the right backend?
- Is the OpenTelemetry Collector pipeline working?
- Are Kubernetes workloads properly instrumented?
- Can we route telemetry to Prometheus, Grafana, Jaeger, or another backend?
For SRE engineers, OpenTelemetry helps answer:
- Which service caused the incident?
- Which request path is slow?
- Which dependency increased latency?
- Are traces connected with logs?
- Are metrics useful for SLOs?
- Is telemetry reliable enough for incident response?
- Are we collecting the right signals without creating too much cost?
For developers, OpenTelemetry helps answer:
- How does my code behave in production?
- Which function or dependency is slow?
- Where should I add custom spans?
- Which business operation should have custom metrics?
- Are errors visible with enough context?
This is why OpenTelemetry training is valuable across DevOps, SRE, cloud engineering, platform engineering, backend development, and application support.
OpenTelemetry Is Not Just Distributed Tracing
Many learners think OpenTelemetry is only about tracing.
That is understandable because distributed tracing is one of its most popular use cases.
But OpenTelemetry is broader than tracing.
It supports three major observability signals:
1. Traces
Traces show the journey of a request across services.
They help engineers understand request flow, latency, dependency behavior, and service relationships.
2. Metrics
Metrics are numerical measurements collected over time.
They help teams monitor system health, performance, throughput, errors, latency, resource usage, and SLOs.
3. Logs
Logs are event records.
They provide detailed context, error messages, stack traces, application events, and debugging information.
The real power of OpenTelemetry comes from connecting these signals.
A metric may show that latency increased.
A trace may show which service caused the delay.
A log may show the exact error message or exception.
When traces, metrics, and logs are correlated, troubleshooting becomes much faster.
That is the heart of modern observability.
Why Distributed Tracing Is the Best Starting Point
If you are new to OpenTelemetry, start with distributed tracing.
Why?
Because tracing makes the value of OpenTelemetry visible very quickly.
Imagine a user clicks “Place Order” in an e-commerce application.
That request may go through:
- Frontend service
- API gateway
- Authentication service
- Cart service
- Inventory service
- Payment service
- Order service
- Notification service
- Database
- Cache
- Message queue
- External payment provider
If the checkout takes 8 seconds, where is the delay?
Metrics may show high latency.
Logs may show warnings.
But a trace can show the actual request path and how much time each service consumed.
A trace helps you see:
- Total request duration
- Individual service duration
- Parent-child relationships
- Failed spans
- Slow dependencies
- Database calls
- External API delays
- Service-to-service communication
- Where the request spent most of its time
For beginners, this is powerful because it turns an invisible distributed system into a visible request journey.
That is why most OpenTelemetry learning paths should begin with traces.
Core OpenTelemetry Concepts You Must Learn
Before jumping into tools, understand the language of OpenTelemetry.
Span
A span represents one operation in a trace.
Examples:
- HTTP request
- Database query
- Function call
- Message queue publish
- External API call
Each span usually has a name, start time, end time, duration, attributes, status, and events.
Trace
A trace is a collection of spans that represent the full journey of a request.
For example, one checkout request may generate a trace containing spans from frontend, cart, payment, inventory, and order services.
Context Propagation
Context propagation allows trace information to move from one service to another.
Without context propagation, traces break apart and you cannot see the full request journey.
Attributes
Attributes are key-value pairs attached to spans, metrics, logs, or resources.
Examples:
- service.name
- http.method
- http.status_code
- db.system
- k8s.namespace.name
- cloud.region
Attributes make telemetry searchable and meaningful.
Resource
A resource describes the entity producing telemetry.
Examples:
- Service name
- Service version
- Environment
- Kubernetes pod
- Host
- Cloud region
Instrumentation
Instrumentation is the process of adding telemetry to your application.
It can be automatic or manual.
Auto-Instrumentation
Auto-instrumentation captures telemetry from supported frameworks and libraries with minimal code changes.
This is usually the easiest starting point.
Manual Instrumentation
Manual instrumentation allows developers to add custom spans, attributes, metrics, and events for business-specific logic.
This is important for deeper observability.
OpenTelemetry Collector
The OpenTelemetry Collector receives, processes, and exports telemetry data.
It is one of the most important components in production OpenTelemetry architecture.
OTLP
OTLP stands for OpenTelemetry Protocol.
It is the standard protocol used to send telemetry data between OpenTelemetry components and backends.
OpenTelemetry Architecture Explained Simply
A basic OpenTelemetry architecture looks like this:
- Your application is instrumented using OpenTelemetry SDKs or auto-instrumentation.
- The application generates traces, metrics, and logs.
- Telemetry data is sent to the OpenTelemetry Collector.
- The Collector receives, processes, filters, batches, enriches, and exports the data.
- Telemetry is sent to observability backends such as Prometheus, Grafana Tempo, Jaeger, Loki, Elasticsearch, Datadog, Dynatrace, or New Relic.
- Engineers use dashboards, alerts, logs, and traces to monitor and troubleshoot systems.
This architecture is important because the Collector gives you flexibility.
Without a Collector, every application may need to know exactly where to send telemetry.
With a Collector, applications send telemetry to a common pipeline, and the Collector decides where it goes.
That makes observability easier to manage at scale.
What You Should Learn in an OpenTelemetry Course
A good OpenTelemetry course should not only teach definitions.
It should teach implementation.
Here is what a complete OpenTelemetry course should cover.
1. Observability Foundations
Before learning OpenTelemetry, you must understand observability.
Learn:
- Monitoring vs observability
- Metrics, logs, and traces
- Telemetry
- Instrumentation
- Application performance monitoring
- Distributed systems
- Microservices debugging
- SLOs and SLIs
- Incident response basics
OpenTelemetry makes more sense when you understand the production problems it solves.
2. Distributed Tracing
Learn:
- Spans
- Traces
- Trace IDs
- Span IDs
- Parent-child relationships
- Context propagation
- Sampling
- Trace attributes
- Trace events
- Error spans
- Latency analysis
- Service dependency maps
This is the foundation of OpenTelemetry learning.
3. OpenTelemetry SDKs
Learn how OpenTelemetry SDKs work for common programming languages.
Depending on your role, focus on one or two languages first:
- Java
- Python
- Node.js
- Go
- .NET
- PHP
- Ruby
Developers should go deeper into SDKs. DevOps and SRE engineers should understand SDK behavior enough to support instrumentation and troubleshoot telemetry pipelines.
4. Auto-Instrumentation
Auto-instrumentation is often the fastest way to start.
Learn how to instrument common frameworks and libraries without large code changes.
This is useful when teams want quick visibility across existing applications.
5. Manual Instrumentation
Manual instrumentation is where advanced observability begins.
Learn how to add:
- Custom spans
- Business attributes
- Custom metrics
- Events
- Error details
- Service-specific context
For example, in a payment service, a custom span around “payment authorization” may be more useful than a generic HTTP span.
6. OpenTelemetry Collector
The Collector is essential for production.
Learn:
- Receivers
- Processors
- Exporters
- Pipelines
- Extensions
- Batching
- Filtering
- Resource detection
- Tail sampling
- Memory limiter
- Kubernetes deployment
- Configuration files
- Debugging Collector pipelines
If you want to become serious with OpenTelemetry, learn the Collector deeply.
7. Metrics with OpenTelemetry
OpenTelemetry metrics help collect application and service measurements.
Learn:
- Counters
- Gauges
- Histograms
- Observable instruments
- Metric attributes
- Aggregation
- Exporting metrics
- Prometheus integration
- SLO-friendly metrics
Metrics are critical for dashboards and alerts.
8. Logs with OpenTelemetry
OpenTelemetry logging is becoming increasingly important for cross-signal correlation.
Learn:
- Log records
- Log attributes
- Trace ID correlation
- Structured logging
- Log collection
- Exporting logs
- Backend integration
Logs become more powerful when connected with traces.
9. Backend Integration
OpenTelemetry is not a dashboard by itself.
You must send telemetry somewhere.
Learn how OpenTelemetry works with:
- Prometheus
- Grafana
- Grafana Tempo
- Grafana Loki
- Jaeger
- Zipkin
- ELK
- Datadog
- Dynatrace
- New Relic
This helps you understand OpenTelemetry in real-world environments.
10. Kubernetes OpenTelemetry
Most modern OpenTelemetry deployments run in Kubernetes.
Learn:
- Collector as Deployment
- Collector as DaemonSet
- Kubernetes attributes
- Pod metadata enrichment
- Node-level collection
- Application instrumentation in Kubernetes
- Sidecar vs gateway deployment models
- Helm-based installation
- Resource limits
- Scaling Collectors
- Multi-namespace observability
Kubernetes OpenTelemetry skills are especially useful for DevOps, SRE, and platform engineers.
OpenTelemetry Certification Roadmap
Certification is useful when it validates real understanding.
For OpenTelemetry, your certification roadmap should be practical, not just theoretical.
Here is a recommended path.
Stage 1: Learn Observability Basics
Before preparing for any OpenTelemetry certification, understand:
- What observability means
- How metrics, logs, and traces differ
- Why distributed systems are hard to debug
- How telemetry supports incident response
- How DevOps and SRE teams use observability
Do not skip this foundation.
Stage 2: Learn Distributed Tracing
Focus on:
- Traces
- Spans
- Context propagation
- Sampling
- Attributes
- Trace visualization
- Trace analysis
- Root cause investigation
This is the fastest way to understand OpenTelemetry’s value.
Stage 3: Learn OpenTelemetry Core Components
Study:
- APIs
- SDKs
- Collector
- Receivers
- Processors
- Exporters
- OTLP
- Semantic conventions
- Resources
- Instrumentation libraries
This stage prepares you for deeper implementation and certification concepts.
Stage 4: Practice with Real Applications
Set up a small application and instrument it.
Use:
- One frontend service
- Two backend services
- One database
- One message queue if possible
- OpenTelemetry SDK or auto-instrumentation
- OpenTelemetry Collector
- Jaeger or Tempo for traces
- Prometheus and Grafana for metrics
Do not only read. Build.
Stage 5: Add Metrics and Logs
Once tracing works, add:
- Application metrics
- Runtime metrics
- HTTP metrics
- Custom business metrics
- Structured logs
- Trace-log correlation
This helps you understand OpenTelemetry beyond traces.
Stage 6: Deploy on Kubernetes
Move the project to Kubernetes.
Add:
- Collector gateway
- Collector DaemonSet if needed
- Kubernetes metadata
- Prometheus scraping
- Grafana dashboards
- Logs collection
- Trace backend
This is where OpenTelemetry becomes production-like.
Stage 7: Prepare for Certification
Now prepare for OpenTelemetry certification topics:
- OTel architecture
- Telemetry signals
- Instrumentation
- Collector pipelines
- Exporters
- Context propagation
- Semantic conventions
- Troubleshooting
- Backend integration
- Use cases for DevOps and SRE
Certification preparation is much easier after hands-on practice.
A Practical 30-Day OpenTelemetry Learning Plan
If you want a focused roadmap, follow this 30-day plan.
Days 1–5: Observability Foundations
Learn:
- Monitoring vs observability
- Metrics, logs, and traces
- Distributed systems
- Telemetry
- Instrumentation
- APM basics
- SLOs and SLIs
Outcome: You understand why OpenTelemetry exists.
Days 6–10: Distributed Tracing
Learn:
- Spans
- Traces
- Parent-child relationships
- Context propagation
- Trace attributes
- Sampling
- Error spans
- Jaeger or Tempo basics
Outcome: You can trace a request across services.
Days 11–15: OpenTelemetry SDKs and Auto-Instrumentation
Learn:
- SDK setup
- Auto-instrumentation
- Manual spans
- Resource attributes
- Service names
- Environment tagging
- Exporters
Outcome: You can instrument a real application.
Days 16–20: OpenTelemetry Collector
Learn:
- Collector architecture
- Receivers
- Processors
- Exporters
- Pipelines
- OTLP
- Batch processor
- Memory limiter
- Debug exporter
Outcome: You can build and troubleshoot telemetry pipelines.
Days 21–25: Metrics, Logs, and Backend Integration
Learn:
- OTel metrics
- OTel logs
- Prometheus integration
- Grafana dashboards
- Loki or ELK logs
- Tempo or Jaeger traces
- Cross-signal correlation
Outcome: You can connect OpenTelemetry to an observability stack.
Days 26–30: Kubernetes and Certification Preparation
Learn:
- OTel Collector on Kubernetes
- Pod metadata enrichment
- Application instrumentation in Kubernetes
- SLO dashboards
- Incident simulation
- Certification review
Outcome: You have a practical OpenTelemetry project and certification-ready foundation.
What Makes a Good OpenTelemetry Course?
Before choosing an OpenTelemetry course, ask these questions.
Does it teach observability foundations?
If a course jumps straight into YAML files without explaining observability, beginners will struggle.
Does it cover traces, metrics, and logs?
A tracing-only course is useful, but incomplete.
OpenTelemetry is about multiple telemetry signals.
Does it teach the Collector deeply?
The Collector is central to production OpenTelemetry.
A good course must include receivers, processors, exporters, and pipelines.
Does it include hands-on labs?
OpenTelemetry cannot be mastered through theory alone.
You need to instrument applications, collect telemetry, deploy Collectors, and debug broken pipelines.
Does it include backend integration?
A good course should show how OpenTelemetry works with tools like Prometheus, Grafana, Jaeger, Tempo, Loki, ELK, Datadog, Dynatrace, or New Relic.
Does it include Kubernetes?
For DevOps and SRE roles, Kubernetes OpenTelemetry skills are extremely valuable.
Does it connect to DevOps and SRE workflows?
A good course should teach how telemetry supports deployments, incidents, SLOs, dashboards, alerts, and root cause analysis.
Does it prepare you for certification?
Certification gives structure and career validation, but only when paired with real hands-on learning.
Recommended OpenTelemetry Training Links with the Right Keywords
If you are comparing OpenTelemetry learning paths, use the right training link with the right keyword intent. Below are natural keyword-rich links you can use inside your learning journey, course recommendation pages, or SEO content.
For Beginners
Start here if you are new to observability and want a complete foundation:
OpenTelemetry course for beginners
This is useful for learners who want to understand OpenTelemetry along with metrics, logs, traces, Prometheus, Grafana, and Kubernetes observability.
For Certification-Focused Learners
Use this when your goal is structured certification preparation:
OpenTelemetry certification training
This fits learners who want a guided certification path with assignments, capstones, and exam-based validation.
For DevOps Engineers
Use this when targeting DevOps professionals:
OpenTelemetry training for DevOps engineers
This is relevant because DevOps engineers need OpenTelemetry to connect deployments, infrastructure, Kubernetes workloads, metrics, dashboards, logs, traces, and alerting.
For SRE Engineers
Use this when targeting SRE professionals:
OpenTelemetry training for SRE engineers
This works well for SREs who need OpenTelemetry for incident response, distributed tracing, SLOs, error budgets, reliability dashboards, and root cause analysis.
For Distributed Tracing
Use this when the content focuses on microservices debugging:
distributed tracing course with OpenTelemetry
This is a strong keyword fit for learners who want to trace requests across services and troubleshoot latency in distributed systems.
For Full Observability Engineering
Use this when the goal is broader than OpenTelemetry alone:
Master in Observability Engineering Certification
This is the best anchor text when recommending a complete observability course covering OpenTelemetry, Prometheus, Grafana, ELK, Jaeger, Kubernetes observability, SLOs, assignments, capstones, and certification.
For Hands-On Learners
Use this when the audience wants labs and real practice:
hands-on OpenTelemetry and observability training
This fits learners who do not want only theory and need real-world labs, assignments, and capstone projects.
Why DevOpsSchool’s Master in Observability Engineering Certification Is a Strong Fit
OpenTelemetry is powerful, but it should not be learned in isolation.
In real production environments, OpenTelemetry is part of a larger observability ecosystem.
You may use OpenTelemetry to collect traces, but you still need Grafana to visualize signals. You may export metrics to Prometheus. You may send traces to Jaeger or Tempo. You may send logs to ELK or Loki. You may deploy Collectors in Kubernetes. You may use SLOs and alerts to support reliability.
That is why a broader observability certification is often more useful than a narrow OpenTelemetry-only tutorial.
DevOpsSchool’s Master in Observability Engineering Certification is a strong fit because it covers OpenTelemetry as part of a complete observability engineering roadmap.
The training includes:
- OpenTelemetry fundamentals
- Distributed tracing
- Metrics, logs, and traces
- Prometheus
- Grafana
- ELK and EFK
- Jaeger and Zipkin
- Datadog
- Dynatrace
- New Relic
- Kubernetes observability
- SLOs, SLIs, and error budgets
- Assignments
- Capstone projects
- Live interactive sessions
- Certification exam
This matters because real observability work is not tool-specific.
A production engineer must understand how signals flow across systems.
The value of the DevOpsSchool program is that it teaches OpenTelemetry in context. You do not only learn what a span is. You learn how telemetry fits into dashboards, alerts, logs, traces, Kubernetes platforms, and incident response.
That is exactly how DevOps and SRE teams use observability in real life.
How This Certification Helps DevOps Engineers
DevOps engineers often own the platforms where observability runs.
They may be responsible for Kubernetes clusters, CI/CD pipelines, cloud infrastructure, monitoring tools, deployment automation, and alert routing.
OpenTelemetry helps DevOps engineers create a standard telemetry layer across services and environments.
With the right training, a DevOps engineer can:
- Deploy OpenTelemetry Collectors
- Configure telemetry pipelines
- Route traces to Jaeger or Tempo
- Export metrics to Prometheus
- Visualize data in Grafana
- Collect logs into ELK or Loki
- Add Kubernetes metadata to telemetry
- Support developers with instrumentation
- Improve deployment visibility
- Reduce troubleshooting time
The DevOpsSchool certification fits this need because it combines OpenTelemetry with Prometheus, Grafana, Kubernetes observability, logging, tracing, alerting, and capstone projects.
That combination is practical for DevOps roles.
How This Certification Helps SRE Engineers
SRE engineers need telemetry that supports reliability decisions.
OpenTelemetry helps SREs understand service behavior across distributed systems.
With OpenTelemetry, SREs can:
- Trace user requests across services
- Identify latency bottlenecks
- Connect traces with logs
- Track service dependencies
- Build SLO dashboards
- Analyze incident impact
- Improve alert quality
- Reduce mean time to resolution
- Understand production behavior after deployments
The DevOpsSchool certification is useful for SREs because it goes beyond tool setup.
It includes SLOs, SLIs, error budgets, incident-oriented thinking, distributed tracing, logs, metrics, dashboards, and real-world capstone work.
That is what SREs need: not just telemetry collection, but reliability insight.
How This Certification Helps Developers
Developers are increasingly expected to write observable applications.
OpenTelemetry helps developers add visibility directly into code.
With OpenTelemetry skills, developers can:
- Add custom spans
- Add meaningful attributes
- Track business operations
- Capture errors with context
- Create custom metrics
- Propagate trace context
- Connect logs with traces
- Understand production performance
This is especially useful for backend engineers working with microservices, APIs, databases, queues, and external dependencies.
A developer who understands OpenTelemetry writes code that is easier to debug, operate, and improve.
Practical OpenTelemetry Project for Your Portfolio
If you want to prove your OpenTelemetry skills, build this project.
Project: End-to-End OpenTelemetry Observability for a Microservices Application
Create or deploy a small microservices application with:
- Frontend service
- API service
- Payment service
- Order service
- Database
- Message queue
- Kubernetes deployment
Then add:
- OpenTelemetry auto-instrumentation
- Manual custom spans
- OpenTelemetry Collector
- Metrics export to Prometheus
- Dashboard visualization in Grafana
- Traces export to Jaeger or Tempo
- Logs export to Loki or ELK
- Trace-log correlation
- Kubernetes metadata enrichment
- SLO dashboard
- Alert rules
- Failure simulation
Simulate production problems:
- Slow database query
- Payment service timeout
- Pod restart loop
- High error rate
- External API delay
- Queue backlog
Then use OpenTelemetry data to investigate.
Your final deliverables should include:
- Architecture diagram
- Collector configuration
- Grafana dashboard screenshots
- Trace examples
- Metrics queries
- Log correlation examples
- Alert rules
- Incident report
- Lessons learned
This kind of project is far more valuable than simply saying “I know OpenTelemetry.”
It shows you can apply it.
Common Mistakes While Learning OpenTelemetry
Mistake 1: Starting with the Collector Before Understanding Traces
The Collector is important, but beginners should first understand traces, spans, context propagation, and instrumentation.
Otherwise, Collector YAML feels confusing.
Mistake 2: Using Auto-Instrumentation Only
Auto-instrumentation is a great start, but manual instrumentation is needed for business context.
A generic HTTP span may show that an endpoint is slow.
A custom business span can show that payment authorization, inventory lookup, or discount calculation caused the delay.
Mistake 3: Ignoring Context Propagation
Broken context propagation creates broken traces.
If traces are not connected across services, troubleshooting becomes difficult.
Mistake 4: Sending Telemetry Directly from Every App to Every Backend
This becomes hard to manage.
Use the OpenTelemetry Collector to centralize and control telemetry pipelines.
Mistake 5: Collecting Too Much Data
More telemetry is not always better.
Too much data increases cost, noise, and storage pressure.
Learn sampling, filtering, batching, and retention strategies.
Mistake 6: Forgetting Logs
Traces show the request path.
Metrics show trends.
Logs often explain details.
Do not ignore log correlation.
Mistake 7: Treating Certification as the Goal
Certification is useful, but the real goal is capability.
You should be able to instrument, collect, export, visualize, troubleshoot, and explain telemetry.
Recommended Learning Order: OpenTelemetry, Prometheus, Grafana, or Kubernetes?
Many learners ask:
“What should I learn first?”
Here is the best order.
First: Observability Basics
Learn metrics, logs, traces, monitoring, instrumentation, and incident response.
Second: Prometheus and Metrics
Learn metrics collection and PromQL.
This makes dashboards and alerts more meaningful.
Third: Grafana
Learn dashboards, alerts, panels, variables, and visualization.
Fourth: Distributed Tracing
Learn traces, spans, context propagation, and service maps.
Fifth: OpenTelemetry
Learn SDKs, auto-instrumentation, manual instrumentation, Collector, and OTLP.
Sixth: Logs and Correlation
Learn structured logs, trace IDs, log pipelines, and debugging workflows.
Seventh: Kubernetes Observability
Learn how to deploy and operate telemetry systems in Kubernetes.
Eighth: SLOs and Reliability
Learn how to convert telemetry into reliability decisions.
This learning order avoids confusion and builds skill layer by layer.
Final Recommendation
OpenTelemetry is one of the most important observability skills for modern engineers.
It gives teams a standard way to collect traces, metrics, and logs across distributed systems. It helps DevOps teams standardize telemetry pipelines. It helps SRE teams troubleshoot incidents and measure reliability. It helps developers write applications that are easier to understand in production.
But OpenTelemetry should not be learned as a standalone buzzword.
To use it properly, you need to understand observability foundations, distributed tracing, metrics, logs, OpenTelemetry Collector, backend integrations, Kubernetes deployment, Grafana dashboards, Prometheus metrics, SLOs, and real incident workflows.
That is why a structured certification program can be extremely useful.
The Master in Observability Engineering Certification by DevOpsSchool is a strong fit for learners who want OpenTelemetry training inside a complete observability roadmap. It connects OpenTelemetry with Prometheus, Grafana, ELK, Jaeger, Kubernetes observability, SLOs, assignments, capstone projects, and certification-based validation.
For beginners, it gives structure.
For DevOps engineers, it gives platform-level observability skills.
For SRE engineers, it gives reliability-focused troubleshooting skills.
For developers, it gives instrumentation confidence.
And for teams, it creates engineers who can look at distributed systems, follow the signals, find the cause, and improve production reliability.
That is the real value of OpenTelemetry.
FAQs
What is OpenTelemetry?
OpenTelemetry is an open-source observability framework used to generate, collect, process, and export telemetry data such as traces, metrics, and logs.
Is OpenTelemetry only for distributed tracing?
No. OpenTelemetry supports traces, metrics, and logs. Distributed tracing is one of its most popular use cases, but it is not the only one.
What should I learn first in OpenTelemetry?
Start with observability basics, then learn traces and spans, then OpenTelemetry SDKs, auto-instrumentation, manual instrumentation, Collector pipelines, metrics, logs, and backend integration.
Is OpenTelemetry useful for DevOps engineers?
Yes. DevOps engineers use OpenTelemetry to standardize telemetry pipelines, support application instrumentation, deploy Collectors, integrate with observability tools, and improve production visibility.
Is OpenTelemetry useful for SRE engineers?
Yes. SRE engineers use OpenTelemetry for distributed tracing, incident response, latency analysis, service dependency mapping, SLO monitoring, and root cause analysis.
What is the OpenTelemetry Collector?
The OpenTelemetry Collector is a component that receives, processes, and exports telemetry data. It helps teams manage telemetry pipelines in a flexible and vendor-neutral way.
What tools work with OpenTelemetry?
OpenTelemetry can work with Prometheus, Grafana, Jaeger, Tempo, Loki, ELK, Datadog, Dynatrace, New Relic, and many other observability backends.
Is OpenTelemetry certification worth it?
Yes, OpenTelemetry certification is useful for DevOps, SRE, cloud, platform, and backend engineers who want to validate skills in telemetry, instrumentation, distributed tracing, metrics, logs, and observability pipelines.
Which course is best for OpenTelemetry training?
A strong OpenTelemetry course should include traces, metrics, logs, OpenTelemetry Collector, SDKs, auto-instrumentation, manual instrumentation, Prometheus, Grafana, Kubernetes, SLOs, and hands-on projects. DevOpsSchool’s Master in Observability Engineering Certification is a strong fit because it covers OpenTelemetry as part of a complete observability engineering roadmap.
How long does it take to learn OpenTelemetry?
You can learn the basics in a few weeks, but becoming confident requires hands-on practice with real applications, Collector pipelines, distributed tracing, metrics, logs, dashboards, alerts, and Kubernetes deployment.
A useful addition to any OpenTelemetry learning path is spending time troubleshooting real observability issues in a test environment. Understanding how traces, metrics, and logs connect during an actual incident often teaches far more than simply learning the concepts individually.