Introduction
Modern software applications are massive. They run across hundreds of servers, cloud environments, and container clusters. Every second, these systems generate millions of data points, including logs, metrics, and traces.
When a slowdown or outage occurs, the sheer volume of data can overwhelm human operators. Traditional monitoring tools often fail because they rely on simple static thresholds—triggering an alarm only when CPU usage crosses 90%, for example. This leads to alert fatigue, missed warnings, and prolonged downtime.
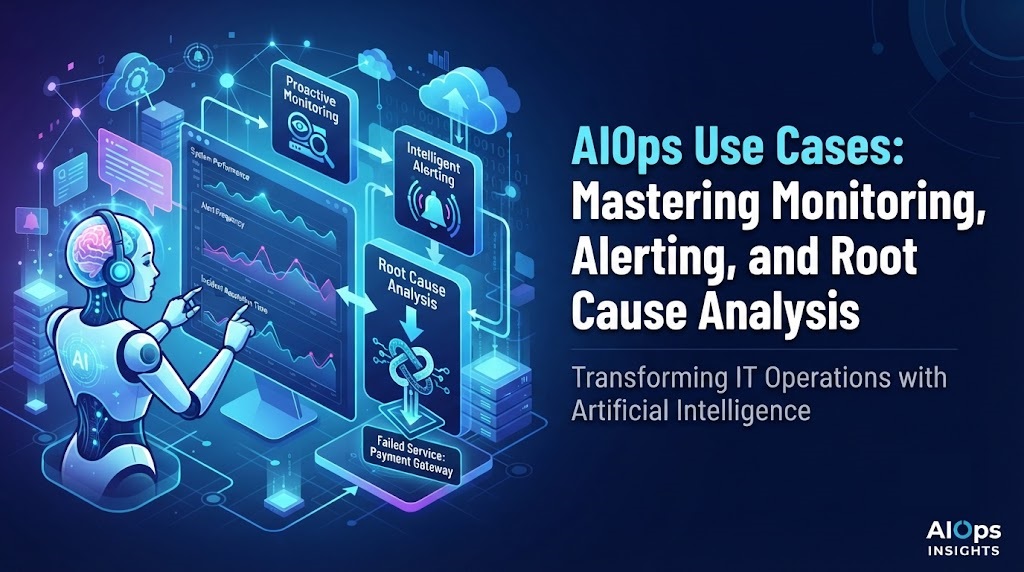
AIOps changes this dynamic. By combining big data with machine learning, it turns raw telemetry into actionable insights. This guide explores core AIOps use cases across monitoring, alerting, and root cause analysis, showing how organizations can shift from reactive firefighting to predictive operations.
What Is AIOps?
AIOps stands for Artificial Intelligence for IT Operations.
In simple terms, it is the practice of using machine learning and data analytics to automate operational workflows. While traditional monitoring tells you what broke after the fact, AIOps analyzes historical and real-time patterns to tell you why it broke, when it might break next, and how to fix it.
Why It Matters
Systems are too complex for manual oversight. AIOps acts as an intelligent assistant that processes petabytes of operational data instantly, letting engineers focus on building features rather than chasing phantom alerts.
How AIOps Works
AIOps platforms ingest data from multiple sources—such as network devices, application performance monitors, cloud services, and user logs.
- Data Ingestion: Gathering logs, metrics, and events into a centralized data lake.
- Pattern Recognition: Machine learning models establish a baseline of normal behavior for the application.
- Anomaly Detection: The system flags deviations from this baseline that traditional thresholds might miss.
- Correlation and Noise Reduction: Related alerts from different systems are grouped into a single incident ticket.
- Remediation: Automated scripts or workflows resolve known issues without human intervention.
Core AIOps Use Cases for Monitoring
Effective monitoring goes beyond checking if a server is online. AIOps improves monitoring through predictive analytics and dynamic baselining.
Dynamic Baselining
Traditional tools use static thresholds (e.g., alert if CPU > 80%). However, traffic naturally fluctuates between day and night, weekdays and weekends. AIOps learns these cyclical patterns to create dynamic baselines, drastically reducing false positives.
Metric Anomaly Detection
Machine learning algorithms monitor complex metric streams continuously. If database response times creep upward by 15%—even while staying well below traditional warning thresholds—the AIOps engine flags the subtle shift before users notice latency.
Predictive Capacity Planning
By analyzing long-term resource utilization trends, AIOps can forecast when storage disks will fill up or when CPU capacity will max out, giving engineering teams weeks of advance notice to scale infrastructure before a bottleneck occurs.
Core AIOps Use Cases for Alerting
Alert fatigue is a major burnout factor for IT and DevOps teams. When every minor blip triggers a page, engineers start ignoring alerts entirely.
Alert Noise Reduction and Deduplication
During a major outage, a single network switch failure can trigger thousands of downstream alerts. AIOps groups these related alerts into one master incident, filtering out up to 90% of operational noise so teams see the signal through the static.
Intelligent Alert Routing
AIOps systems analyze the nature of an incoming alert and automatically route it to the right team or individual based on historical resolution patterns, eliminating manual triage delays and reducing mean time to acknowledge.
Core AIOps Use Cases for Root Cause Analysis (RCA)
Finding the root cause of an issue in a microservices architecture can feel like finding a needle in a haystack.
Automated Correlation Across Silos
When an e-commerce checkout page fails, the problem could lie in the frontend code, the payment gateway API, or the underlying database. AIOps correlates logs, network packets, and application traces across these disparate silos to map the exact chain of events that led to the failure.
Historical Incident Matching
When a new error occurs, the AIOps platform compares its fingerprint against historical incident databases. It surfaces past resolutions and recommended runbooks, guiding engineers straight to a proven fix.
Practical Example: The Friday Night Checkout Glitch
Imagine an online retail platform experiencing a sudden spike in checkout failures on a Friday evening.
- Traditional Approach: The monitoring tool fires 500 alerts for high memory usage, slow database queries, and gateway timeouts. The on-call engineer spends 45 minutes manually checking dashboards to figure out which alert matters.
- AIOps Approach: The AIOps engine ingests all 500 alerts, deduplicates them into a single incident, correlates the database timeout with a specific microservices deployment from 10 minutes prior, and suggests rolling back the container image. Resolution time drops from an hour to five minutes.
Common Mistakes in AIOps Adoption
Organizations often stumble when implementing AI-driven operations due to common pitfalls:
- Garbage In, Garbage Out: Feeding unstructured, dirty log data into the platform yields inaccurate machine learning models. Clean and structure data sources first.
- Over-Automation Too Soon: Allowing automated remediation scripts to make changes without human oversight can cause accidental outages. Start with advisory mode before enabling full automation.
- Treating AIOps as a Magic Wand: Expecting AI to solve deep architectural flaws in poorly written software. AIOps highlights problems; human engineers still need to fix the underlying code.
Risks and Limitations
- Data Privacy Concerns: Ingesting sensitive logs into cloud-based AIOps platforms can expose personal identifiable information (PII) if not properly scrubbed.
- Black Box Problem: Some advanced machine learning models make recommendations without explaining how they reached a conclusion, making it hard for engineers to trust the output.
- High Initial Setup Cost: Configuring integrations, training baselines, and tuning models requires significant upfront engineering effort.
Checklist for AIOps Implementation
- Define clear operational goals (e.g., reduce mean time to resolution by 30%).
- Audit and clean existing monitoring data sources.
- Pilot the AIOps platform on a non-critical application environment.
- Establish baseline alert thresholds and reduce alert noise gradually.
- Implement human-in-the-loop workflows for automated remediation.
- Train operations teams on interpreting AI-driven insights and root cause recommendations.
Key Terms
- Alert Fatigue: Desensitization caused by receiving too many false-positive alerts, leading to delayed responses.
- Anomaly Detection: The automated identification of rare items, events, or observations that raise suspicions by differing significantly from the majority of the data.
- Correlation: The process of linking related events, logs, and alerts together to understand a single underlying problem.
- Log Analytics: The automated parsing and analysis of machine-generated log files to extract useful operational insights.
- Telemetry: The collection of measurements and other data (metrics, logs, traces) from remote or embedded systems.
FAQs
What is the main benefit of AIOps?
AIOps reduces downtime and operational toil by automating data analysis, filtering out alert noise, and pinpointing root causes much faster than human operators can manually.
Does AIOps replace human engineers?
No. AIOps automates repetitive tasks, triage, and data correlation, empowering engineers to focus on higher-value engineering tasks and strategic problem-solving.
How is AIOps different from traditional monitoring?
Traditional monitoring relies on reactive, static rules that tell you when something has broken. AIOps uses machine learning to predict issues, analyze complex patterns, and automate remediation.
Is AIOps suitable for small businesses?
While AIOps is most commonly used in large enterprise environments with complex cloud architectures, smaller businesses can benefit from lightweight monitoring tools that incorporate basic automated alerting and anomaly detection.
What data sources do AIOps platforms require?
AIOps platforms typically ingest metrics, logs, and traces (often called the three pillars of observability) from infrastructure, applications, network devices, and security tools.
Conclusion
AIOps bridges the gap between massive system complexity and human cognitive limits. By transforming noisy data into streamlined alerts and accurate root cause analysis, organizations can maintain high availability, protect user trust, and build more resilient digital services.
As digital infrastructures continue to expand in scale and complexity, relying solely on manual oversight and static threshold alerts is no longer sustainable. Transitioning to an AI-driven operations model allows teams to move past the endless cycle of reactive firefighting.
To take the next step, start small by implementing anomaly detection or alert noise reduction on a non-production environment. Measure your improvements in resolution time, refine your data pipelines, and gradually scale automation as your team gains confidence. Embracing AIOps today is not just about keeping systems online—it is about empowering engineering teams to innovate faster, work smarter, and deliver uninterrupted digital experiences.