Real User Monitoring, commonly referred to as RUM, is a passive monitoring technology that records all user interaction with a website or client-based application. Unlike “synthetic monitoring,” which uses scripts to simulate user behavior in a controlled environment, RUM captures exactly what is happening to actual people in the real world. It tracks how long a page takes to load on a specific person’s browser, in a specific country, using a specific internet service provider. Essentially, it provides a window into the actual digital experience of your customers, allowing you to see where they struggle, where the site lags, and where they eventually drop off.
This data is vital because a developer’s high-speed office internet never matches the reality of a user on a 3G connection in a moving train. RUM tools are important for identifying “long-tail” performance issues that automated tests might miss. Key real-world use cases include optimizing checkout flows in e-commerce, verifying that a new software update hasn’t slowed down mobile users, and troubleshooting regional latency issues. When evaluating these tools, users should prioritize ease of integration, the depth of “Core Web Vitals” reporting, the ability to correlate frontend speed with backend errors, and data privacy features.
Best for: * Product Managers and UX Designers: Who need to understand how site speed impacts conversion rates.
- Frontend Developers: Who want to see how their code performs across various browsers and devices.
- Large E-commerce and SaaS Enterprises: Companies where every 100ms of latency directly correlates to lost revenue.
Not ideal for:
- Backend-only Services: If you are managing internal APIs that don’t have a user-facing frontend, Distributed Tracing or APM tools are more appropriate.
- Low-Traffic Hobbyist Sites: If your site has only a few visitors a day, the data won’t be statistically significant enough to justify the cost.
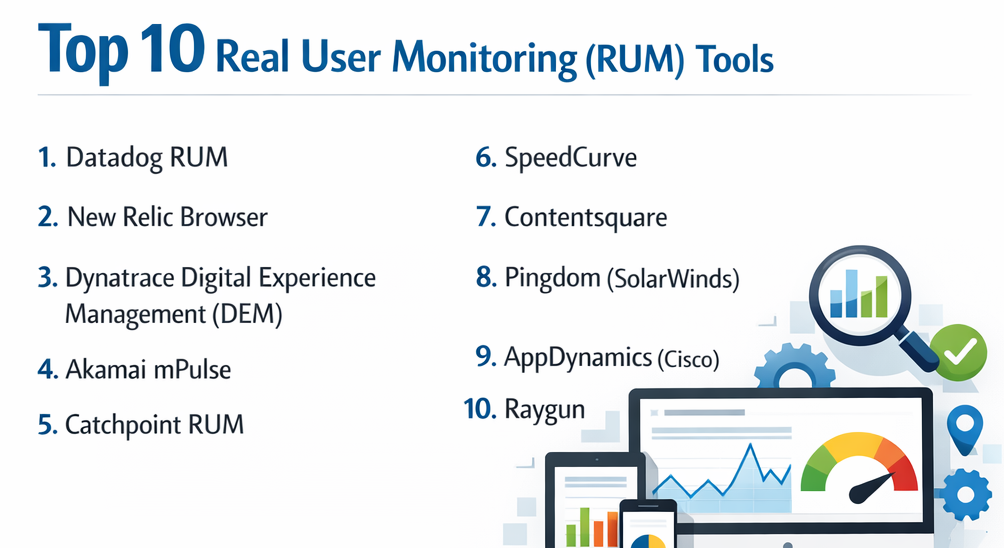
Top 10 Real User Monitoring (RUM) Tools
1 — Datadog RUM
Datadog RUM provides end-to-end visibility into the real-time activity and experience of individual users. It is designed for modern DevOps teams who want to link frontend performance directly to backend traces.
- Key features:
- Visualizes user journeys with detailed session replays.
- Automatic correlation between frontend errors and backend traces.
- Real-time dashboards for Core Web Vitals (LCP, FID, CLS).
- Geographic, browser, and device-based performance breakdown.
- Error tracking with full stack traces and source maps.
- Frustration signals detection (rage clicks, dead clicks).
- Pros:
- Exceptional at breaking down silos between frontend and backend teams.
- Highly customizable dashboards that can be shared across the organization.
- Cons:
- The pricing structure can be complex and expensive for high-traffic sites.
- The sheer amount of data can be overwhelming for smaller teams.
- Security & compliance: SOC 2 Type II, HIPAA, GDPR, and ISO 27001 compliant; offers PII masking in session replays.
- Support & community: Extensive documentation, a robust Slack community, and 24/7 technical support for enterprise tiers.
2 — New Relic Browser
New Relic Browser is a heavyweight in the monitoring space, offering deep insights into how your website’s performance affects your business outcomes.
- Key features:
- Detailed analysis of JavaScript errors and AJAX requests.
- Tracking of single-page application (SPA) transitions.
- Comparative views of performance before and after a code deployment.
- Session traces that show a chronological timeline of page events.
- Integration with the broader New Relic observability platform.
- Customizable alerting based on performance thresholds.
- Pros:
- The “NRQL” query language allows for incredibly deep and specific data analysis.
- Excellent for large organizations that need a standardized tool across multiple departments.
- Cons:
- The user interface can feel cluttered and has a steep learning curve.
- Subscription costs can scale rapidly as the number of users or data volume increases.
- Security & compliance: SOC 2, HIPAA, GDPR, and FedRAMP (for specific versions) compliant.
- Support & community: Large user base, comprehensive “New Relic University” for training, and active support forums.
3 — Dynatrace Digital Experience Management (DEM)
Dynatrace uses advanced AI to monitor every user journey across web, mobile, and custom applications, focusing on automated root-cause analysis.
- Key features:
- AI-powered “Davis” engine for automatic problem detection and resolution.
- Session Replay that allows you to watch a user’s experience in 4K-like detail.
- Seamless monitoring across hybrid and multi-cloud environments.
- Business impact analysis (linking performance to revenue).
- Integrated mobile app monitoring for iOS and Android.
- Support for modern web frameworks like Angular, React, and Vue.
- Pros:
- Requires very little manual configuration due to its high level of automation.
- The AI does the “heavy lifting” of finding the cause of a performance dip.
- Cons:
- One of the most expensive options on the market.
- Can feel like a “black box” where you have less control over the underlying logic.
- Security & compliance: SOC 2, GDPR, HIPAA, and ISO 27001 compliant; advanced data masking capabilities.
- Support & community: Premier enterprise support, dedicated account managers, and an extensive documentation library.
4 — Akamai mPulse
Akamai mPulse is a high-performance RUM tool that excels in identifying the direct relationship between page load speeds and business conversion rates.
- Key features:
- Real-time monitoring of over 200 performance and business metrics.
- Predictive analytics to show how much more money you would make if the site were faster.
- Statistical analysis to filter out “bot” traffic from human performance data.
- Waterfall charts for individual user sessions.
- Deep integration with Akamai’s Content Delivery Network (CDN).
- Custom “Timers” and “Metrics” for specific business goals.
- Pros:
- Unrivaled at proving the ROI of performance optimization to executives.
- Handles massive global traffic volumes better than almost any other tool.
- Cons:
- The interface feels a bit dated compared to modern SaaS startups.
- Best utilized by companies already within the Akamai ecosystem.
- Security & compliance: SOC 2, PCI DSS, GDPR, and HIPAA compliant.
- Support & community: Professional services available for implementation; enterprise-grade support.
5 — Catchpoint RUM
Catchpoint is unique because it combines RUM with one of the world’s largest synthetic monitoring networks, providing a 360-degree view of performance.
- Key features:
- Integrated view of RUM and synthetic data in a single dashboard.
- Detailed ISP and network path analysis.
- Support for monitoring internal employee applications.
- Advanced filtering by geography, device type, and connection speed.
- Detailed waterfall views of every asset loaded in a user’s browser.
- Pros:
- Excellent for troubleshooting regional connectivity issues or DNS problems.
- Very reliable data with minimal “noise” from bot traffic.
- Cons:
- Can be complex to set up and configure for multi-page applications.
- Pricing is geared toward larger enterprises rather than small businesses.
- Security & compliance: SOC 2 Type II and GDPR compliant.
- Support & community: Renowned for high-touch customer support and technical expertise.
6 — SpeedCurve
SpeedCurve is a developer-favorite tool that focuses heavily on the visual aspect of performance and design-led metrics.
- Key features:
- Beautiful visualizations of “Visual Completeness” and “Hero Elements.”
- Benchmark comparisons against your competitors’ sites.
- Integrated RUM and synthetic testing focused on Core Web Vitals.
- Budgeting alerts that notify you when a page exceeds its “size” or “speed” budget.
- Detailed reports on JavaScript execution time.
- Pros:
- The most visually intuitive tool for explaining performance to designers and non-engineers.
- Great focus on the “user’s perceived speed” rather than just technical load times.
- Cons:
- Lacks some of the deep “full-stack” APM features of Datadog or Dynatrace.
- The RUM pricing is based on “page views,” which can be pricey for high-traffic sites.
- Security & compliance: GDPR compliant; data is encrypted in transit and at rest.
- Support & community: Small but highly dedicated team with excellent documentation and a popular blog.
7 — Contentsquare
Contentsquare (which acquired LogRocket) goes beyond just speed to understand user behavior and “digital happiness.”
- Key features:
- Zone-based heatmaps showing where users click and scroll.
- Session replay with technical logs for debugging.
- Impact quantification to show how much revenue a specific bug is costing.
- Automatic detection of “struggle” (loops, rage clicks).
- Integration with major e-commerce platforms like Shopify and Salesforce.
- Pros:
- Bridges the gap between “technical performance” and “marketing analytics.”
- Superior at showing why a user didn’t complete a purchase.
- Cons:
- Not a “pure” performance tool; it focuses more on behavior.
- Can be very expensive for small and mid-sized companies.
- Security & compliance: SOC 2 Type II, GDPR, and HIPAA compliant.
- Support & community: Excellent onboarding and “Customer Success” programs.
8 — Pingdom (SolarWinds)
Pingdom is well-known for its simplicity and affordability, making it a go-to choice for small to medium-sized businesses.
- Key features:
- Easy-to-install RUM script for basic performance tracking.
- Geographic breakdown of load times.
- Tracking of visitor count and bounce rates.
- Basic browser and device performance comparison.
- Integrated uptime monitoring and synthetic testing.
- Pros:
- Extremely easy to set up, even for people who aren’t developers.
- One of the most cost-effective RUM solutions available.
- Cons:
- Lacks the deep technical diagnostics and AI found in enterprise tools.
- Reporting is basic and may not satisfy complex troubleshooting needs.
- Security & compliance: Varies / N/A (Standard encryption used).
- Support & community: Wide community support and basic technical documentation.
9 — AppDynamics (Cisco)
AppDynamics provides a powerful RUM solution as part of its “Business Observability” suite, designed for massive corporate infrastructures.
- Key features:
- End-to-end transaction tracing from the browser to the database.
- Browser and Mobile RUM in a unified view.
- “Experience Journey Maps” that visualize the most common paths users take.
- Automated baselining to determine what “normal” performance looks like.
- Detailed IoT device monitoring.
- Pros:
- Unmatched for large companies that need to see how a backend server failure impacts a specific user’s mobile screen.
- Very stable and reliable for high-enterprise use.
- Cons:
- Can be extremely complex to deploy and requires significant training.
- Pricing is generally opaque and high-tier.
- Security & compliance: SOC 2, HIPAA, and GDPR compliant.
- Support & community: High-level professional support and a global partner ecosystem.
10 — Raygun
Raygun offers a highly developer-centric RUM tool that focuses on identifying every crash and performance bottleneck in the user’s path.
- Key features:
- Instant alerts for JavaScript errors and performance regressions.
- Detailed “User Timings” to track specific interactions like button clicks.
- Comparison of performance across different app versions.
- Visualizations of the user’s “navigation path” leading up to an error.
- Lightweight script that doesn’t bloat your page weight.
- Pros:
- Excellent value for money for mid-market software companies.
- The crash reporting is among the best in the industry.
- Cons:
- The UI can be a bit more technical than “business-friendly” tools.
- Does not have the broad “marketing” analytics of Contentsquare.
- Security & compliance: HIPAA, GDPR, and SOC 2 Type II compliant.
- Support & community: Responsive customer support and a helpful library of technical webinars.
Comparison Table
| Tool Name | Best For | Platform(s) Supported | Standout Feature | Rating (Gartner/TrueReview) |
| Datadog RUM | Full-stack observability | Web, iOS, Android | Linking UI to backend traces | 4.5 / 5 |
| New Relic | Large dev teams | Web, iOS, Android | NRQL for custom queries | 4.4 / 5 |
| Dynatrace | Enterprises wanting AI | Web, Mobile, IoT | Davis® AI root-cause | 4.6 / 5 |
| Akamai mPulse | E-commerce ROI | Web, Mobile | Correlation with revenue | 4.3 / 5 |
| Catchpoint | Global networking | Web, Mobile | Massive ISP node network | 4.5 / 5 |
| SpeedCurve | Design & UX focus | Web | Visual budget monitoring | 4.7 / 5 |
| Contentsquare | Conversion optimization | Web, Mobile | Zone-based heatmaps | 4.6 / 5 |
| Pingdom | SMBs & Simplicity | Web | Very low cost/setup | 4.0 / 5 |
| AppDynamics | Complex Business Apps | Web, Mobile, IoT | Experience Journey Maps | 4.2 / 5 |
| Raygun | Developer diagnostics | Web, iOS, Android | Real-time crash correlation | 4.4 / 5 |
Evaluation & Scoring of Real User Monitoring (RUM) Tools
To determine which tool offers the best overall value, we have applied a weighted scoring rubric based on industry standards for performance monitoring.
| Category | Weight | Description |
| Core Features | 25% | Core Web Vitals, Error tracking, Session Replay, SPA support. |
| Ease of Use | 15% | Time to value, script installation, dashboard intuitiveness. |
| Integrations | 15% | Connection to APM, CDNs, Slack, and development pipelines. |
| Security & Compliance | 10% | Data masking, PII handling, GDPR/SOC 2 certifications. |
| Performance | 10% | Script weight (is the monitor slowing down the site?). |
| Support & Community | 10% | Documentation, forums, and customer support response. |
| Price / Value | 15% | Transparency and scalability of the pricing model. |
Which Real User Monitoring (RUM) Tool Is Right for You?
Selecting the right RUM tool requires a balance between technical depth and business utility.
Solo Users vs. SMB vs. Mid-Market vs. Enterprise
- Solo Users/Bloggers: Pingdom is the clear winner here. It provides the “big picture” of your site’s health without requiring a large budget or technical expertise.
- SMBs: Raygun or SpeedCurve offer a great balance of technical detail and price. They allow small dev teams to act like large ones without the enterprise overhead.
- Mid-Market: Datadog or New Relic are excellent as they grow with you. They provide the “full-stack” visibility that mid-sized SaaS companies need as they move beyond just a simple frontend.
- Enterprise: Dynatrace or AppDynamics are designed for this scale. They offer the security, AI, and cross-departmental features that a company with thousands of servers requires.
Budget-Conscious vs. Premium Solutions
If budget is the primary concern, start with Pingdom or the free tier of New Relic. However, if you are an e-commerce site doing millions in sales, a “premium” solution like Akamai mPulse or Contentsquare is an investment that pays for itself by finding the friction points where people stop spending money.
Feature Depth vs. Ease of Use
If you want to “set it and forget it,” Dynatrace is your best bet because its AI finds the problems for you. If you have a dedicated performance team that loves digging into data, New Relic or Datadog provide the most powerful query engines to build custom views.
Integration and Scalability
For teams already using AWS, Azure, or Google Cloud extensively, look for a tool that integrates with your “Infrastructure as Code” pipeline. Datadog is currently the industry leader in terms of sheer number of integrations.
Frequently Asked Questions (FAQs)
1. Does RUM slow down my website?
Most RUM tools use a very small, “asynchronous” JavaScript snippet. This means the monitor loads in the background and doesn’t stop your site from appearing to the user. Usually, the impact is less than 10-20ms, which is imperceptible to humans.
2. What is the difference between RUM and Synthetic Monitoring?
Synthetic monitoring is a “lab test”—it uses a robot to check your site from a specific location. RUM is a “field test”—it watches what actually happens when thousands of different people use your site on their own devices.
3. Is RUM compliant with GDPR?
Yes, most top-tier tools are GDPR compliant. However, you must ensure that the tool is set to “mask” PII (Personally Identifiable Information) like names or credit card numbers, especially in session replays.
4. How long is the data stored?
This varies by tool. Most basic plans store data for 30 days, while enterprise plans can store it for 13 months or more to allow for year-over-year performance comparisons.
5. Can RUM track mobile apps?
Yes, but it requires an SDK (Software Development Kit) instead of a simple web script. Tools like Datadog, Dynatrace, and Raygun have excellent support for iOS and Android.
6. Do I need an APM tool if I have RUM?
Ideally, you need both. RUM tells you what the user experienced (e.g., “The page took 5 seconds to load”), while APM tells you why it happened in the code (e.g., “The database query was slow”).
7. What are Core Web Vitals?
These are three specific metrics (LCP, FID, CLS) that Google uses to measure user experience. Most modern RUM tools prioritize these because they impact your SEO ranking.
8. Can RUM help find bugs?
Yes. By using session replays and error tracking, you can see the exact steps a user took before the site crashed, making it much easier to reproduce and fix the bug.
9. Why is there a discrepancy between Google Analytics and RUM tools?
Google Analytics is designed for marketing; RUM is designed for performance. They use different ways of measuring “page loads,” and RUM is generally more accurate regarding technical timing.
10. What is a “Session Replay”?
It is a video-like reconstruction of a user’s journey on your site. You can see their mouse movements, where they clicked, and how they navigated, which is invaluable for understanding user frustration.
Conclusion
Real User Monitoring has moved from being a “nice-to-have” luxury to a fundamental requirement for any digital business. In an era where a one-second delay can lead to a 7% drop in conversions, knowing exactly what your users are experiencing is the only way to remain competitive.
When choosing a tool, remember that the “best” tool is the one that fits your team’s workflow. If you are a small team, prioritize ease of use and price with a tool like Pingdom or SpeedCurve. If you are a large enterprise, prioritize AI and full-stack integration with a tool like Dynatrace or Datadog. Regardless of which you choose, the goal remains the same: transforming raw data into a faster, smoother, and more delightful experience for your real-world users.