Introduction
Mobile performance monitoring tools are specialized software applications that act like a digital doctor for your phone apps. They work by sitting quietly inside an app and watching everything that happens, from how fast a page loads to exactly why the app might suddenly close on its own. When a developer builds an app, they cannot test it on every single type of phone or every kind of internet connection in the world. These tools solve that problem by collecting real data from real people using the app in their daily lives. They report back to the creators with technical details like battery drain, slow internet response times, and “crashes,” which are the frustrating moments when an app just stops working.
Having these tools is essential because the mobile market is very competitive, and users have very little patience for slow or broken software. If a shopping app takes more than a few seconds to process a payment, a customer will likely leave and never come back. Performance monitoring tools give companies the “proof” they need to fix these issues quickly. Instead of guessing why a user is unhappy, the technical team can look at a dashboard and see that a specific button is broken for people using a certain brand of phone. This allows teams to spend less time looking for problems and more time building new features that people enjoy. In simple terms, these tools are the bridge between a “buggy” app that people delete and a high-quality app that people love to use every day.
Key Real-World Use Cases
- Identifying Battery Hogs: Finding out if a specific new feature, like a high-definition video player, is draining the user’s phone battery too quickly.
- Network Speed Optimization: Seeing how the app behaves for a user in a rural area with a very slow 3G connection compared to someone on fast office Wi-Fi.
- Crash Forensics: Capturing the exact state of the phone—such as how much memory was left—at the very second the app crashed.
- UI Responsiveness: Tracking “frozen frames” or “jank” where the screen feels like it is stuttering when a user tries to scroll through a list.
- Third-Party Plugin Monitoring: Checking if an outside tool, like a map service or a login button, is the reason why the app is taking a long time to start up.
What to Look For (Evaluation Criteria)
When you are picking a tool for your team, the first thing to check is ease of integration, which means how easy it is to add the tool to your app without breaking anything. You should also look for Real User Monitoring (RUM) because seeing what actual people experience is much more helpful than just doing “fake” tests in a lab. Another big feature is Session Replay, which acts like a video recording that shows you the user’s path leading up to a problem. Lastly, make sure the tool has smart alerting so your team gets a notification immediately when something major goes wrong, rather than finding out days later from a bad review in the app store.
Best for: Mobile application developers, quality assurance (QA) testers, and product managers at companies of all sizes. It is especially helpful for businesses where the mobile app is the main way customers interact with them, such as in banking, food delivery, and travel.
Not ideal for: Simple apps that work entirely offline, or small personal projects with only a handful of users. If you are just learning how to code and your app doesn’t have a backend or internet connection, you probably don’t need the advanced features and costs of these professional tools.
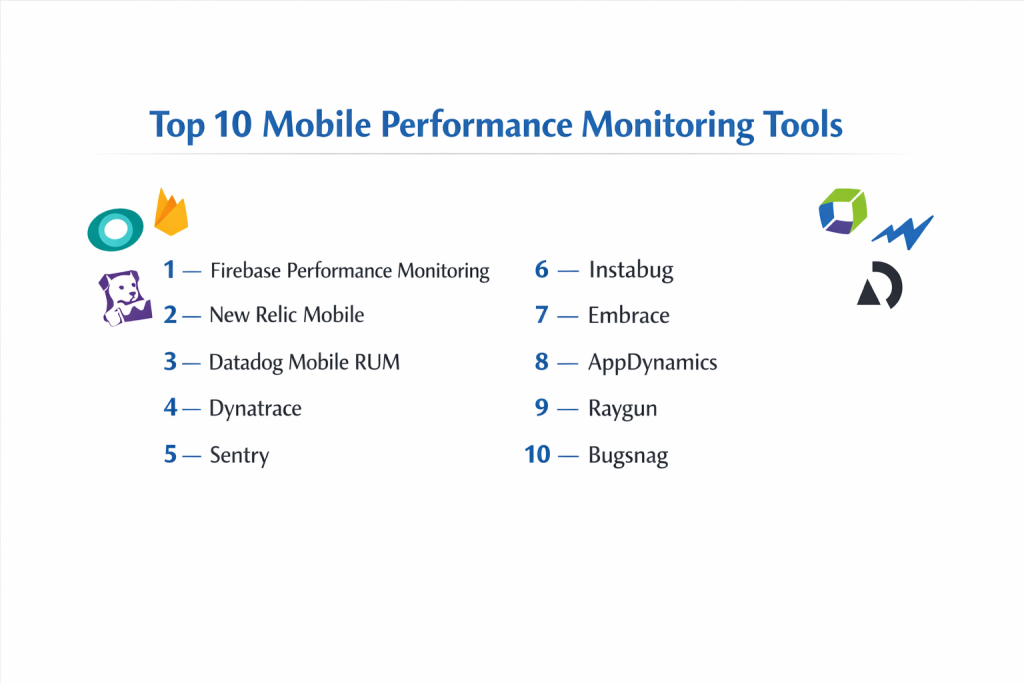
Top 10 Mobile Performance Monitoring Tools
1 — Firebase Performance Monitoring
Firebase is a famous platform owned by Google that offers a huge set of tools for building apps. Its performance monitoring service is one of the most popular because it is very easy to turn on if you are already using other Google services. It gives you a clear look at how your app is doing without needing to be a computer expert.
This tool is especially great for startups because it scales perfectly as you grow. It automatically starts tracking things like how long it takes for your app to show its first screen to the user. Because it is a Google product, it works incredibly well with Android phones, but it also provides great data for iPhone users too.
- Key features:
- Automatic Trace Collection: It starts measuring app start-up and screen rendering times the moment you install it.
- Network Request Monitoring: Shows you exactly which web links are slow or failing to load data.
- Custom Traces and Attributes: You can tag specific parts of your app, like a “Check Out” button, to see exactly how long that one action takes.
- Global Performance Dashboard: Displays a map of the world showing where users are experiencing the most slowness.
- App Version Comparison: Lets you see if your latest update is performing better or worse than the previous one.
- Deep Integration: Works seamlessly with Google Analytics and Firebase Crashlytics for a complete view.
- Pros:
- Cost Effective: The basic performance monitoring features are completely free for almost every user.
- Low Impact: It is designed to be very “light,” meaning it won’t make your app bigger or slower.
- Fast Setup: You can often get it running by just adding a few lines of code to your project.
- Cons:
- Delayed Data: It can sometimes take several hours for the data to show up on your dashboard.
- No Visual Replays: Unlike some competitors, you cannot “watch” a video of what the user was doing.
- Basic Reporting: It doesn’t offer the deep, complex “business” reports that large enterprises might want.
- Security & compliance: High-level encryption from Google; GDPR and SOC 2 compliant.
- Support & community: Huge community with millions of developers; thousands of free video tutorials and guides.
2 — New Relic Mobile
New Relic is a powerful tool used by very large companies that need to see the “full picture.” It doesn’t just watch the phone; it also watches the servers that the phone talks to. This is called “full-stack” monitoring, and it is vital for finding problems that are hidden deep in the system.
Many professional teams choose New Relic because it creates very detailed charts and graphs that help explain complex problems to managers. It is designed for apps that have a lot of moving parts and need to stay online 100% of the time. While it takes more effort to learn, the amount of information it gives you is almost unmatched.
- Key features:
- Distributed Tracing: Follows a user’s request from their thumb on the screen all the way to the database in the cloud.
- Interaction Trails: Shows the sequence of events (like button clicks) that happened right before a crash.
- Crash Analysis and Symbolication: Turns messy computer errors into readable text so developers know exactly which line of code to fix.
- Custom Alerting: Sends messages to Slack or email when performance drops below a certain level.
- Mobile-to-Service Maps: Visually maps out how your app connects to different internet services.
- Advanced Usage Metrics: Tracks how many people are using different versions of your app across different phone brands.
- Pros:
- Deep Visibility: Finds “hidden” bugs that simple tools might miss by looking at the server side.
- Highly Customizable: You can build your own dashboards to show only the data you care about.
- Multi-Platform: Excellent support for both native apps and hybrid apps like React Native.
- Cons:
- Expensive Pricing: It can become very costly as your app gets more users.
- Difficult to Learn: The interface has so many buttons and options that it can be confusing for beginners.
- Complex Setup: Setting up the “full-stack” tracing requires more technical knowledge than simpler tools.
- Security & compliance: ISO 27001 certified, HIPAA compliant, and supports Single Sign-On (SSO).
- Support & community: Great professional support for paying customers and a very active technical forum.
3 — Datadog Mobile RUM
Datadog is a leader in what is called “Real User Monitoring” or RUM. They believe that the best way to fix an app is to see exactly what the person using it is seeing. Their tool is very modern and is built for teams that move fast and update their apps frequently.
One of the coolest things about Datadog is how it organizes information. It groups similar problems together so your developers don’t get overwhelmed by thousands of error messages. It is a “premium” tool, meaning it costs more, but it saves a lot of time by making the cause of problems very obvious.
- Key features:
- Session Replay: Allows you to watch a visual recreation of a user’s session to see exactly where they got stuck.
- Error Tracking and Grouping: Automatically puts similar crashes into buckets so you can fix the biggest problems first.
- Mobile Vitals: Tracks industry-standard “health” scores for things like app start-up and frame rate.
- Frustration Signals: Detects things like “rage clicks” where a user taps a button repeatedly because it isn’t working.
- Unified Platform: Put your mobile data right next to your server and cloud data in one place.
- Intelligent Filtering: Lets you look at performance for specific groups, like “users on iPhone 15 in London.”
- Pros:
- Speed of Discovery: The visual replays make it incredibly fast to understand why a user is having trouble.
- Beautiful Design: The dashboards are very clean and easy to read, even for people who aren’t developers.
- High Reliability: The tool is very stable and can handle apps with millions of active users.
- Cons:
- Pricing Complexity: They charge based on “units” and “sessions,” which can make it hard to predict your monthly bill.
- Heavy Setup: It takes some time to configure all the features correctly to get the most value.
- Not for Small Budgets: Smaller teams might find the cost too high compared to free alternatives.
- Security & compliance: SOC 2 Type II compliant, GDPR ready, and offers strong data privacy controls.
- Support & community: Provides excellent documentation and fast, human support for its customers.
4 — Dynatrace
Dynatrace is often called the “smartest” tool on this list because it uses Artificial Intelligence (AI) to do the hard work for you. Instead of you looking at charts to find an error, the Dynatrace AI, named “Davis,” watches the app and tells you exactly what is wrong and how many people are affected.
This tool is built for the world’s biggest corporations, like global banks and insurance companies. It is designed to work in “complex environments” where an app might be connected to hundreds of different servers at once. It is very expensive, but for a large company, the time it saves can be worth millions of dollars.
- Key features:
- AI-Powered Root Cause Analysis: The system tells you the “Why” behind a problem, not just the “What.”
- Automatic Discovery: It automatically finds all the components of your app and starts monitoring them.
- User Experience Scoring: Gives every single user session a “happy” or “unhappy” score based on performance.
- Digital Experience Monitoring: Combines mobile monitoring with web and synthetic tests in one screen.
- Code-Level Diagnostics: Allows engineers to look at the exact line of code that is slowing down the phone.
- Business Impact Analysis: Shows how performance problems are affecting your sales and revenue.
- Pros:
- Saves Expert Time: The AI does the job of a senior engineer by finding the source of bugs automatically.
- Massive Scalability: It is built to monitor the largest and most complex app systems in the world.
- All-in-One Solution: You don’t need other tools because Dynatrace monitors everything from the app to the cloud.
- Cons:
- Very High Cost: This is one of the most expensive software tools a company can buy.
- Steep Learning Curve: It is so powerful that it requires special training to use all its features correctly.
- Resource Intensive: Some users find that the tool itself can take up a bit of computer power to run.
- Security & compliance: Meets the highest government standards, including FedRAMP and HIPAA.
- Support & community: Premium enterprise support with dedicated experts available 24/7.
5 — Sentry
Sentry is a tool that was “built by developers, for developers.” It focuses on being simple, fast, and very good at tracking code errors. While it used to only track crashes, it has now become a full performance monitor that shows you exactly where your app is lagging.
Developers love Sentry because it doesn’t have a lot of “corporate fluff.” It gets straight to the point and shows you the code. It is a great middle-ground tool for teams that are too big for the basic free tools but don’t want the massive complexity of enterprise software.
- Key features:
- Detailed Stack Traces: Shows the exact “path” the code took before it failed, right down to the specific file.
- Breadcrumbs: A timeline of everything the user did (like “clicked home,” “opened settings”) before the error.
- Performance Vitals: Tracks “Cold Starts” and “Warm Starts” to see if your app is opening fast enough.
- Release Health: Tells you what percentage of your users are having a “crash-free” experience on each version.
- Distributed Tracing: Shows how slow code on the phone might be caused by a slow response from the server.
- Integration with Code Repos: Links errors directly to your code on sites like GitHub or GitLab.
- Pros:
- Very User-Friendly: The interface is clean and stays focused on helping developers fix things fast.
- Fair Pricing: Offers a great free tier for small projects and affordable plans for growing teams.
- Quick Insights: You can see exactly what is wrong within seconds of an error happening.
- Cons:
- Less Business Reporting: It doesn’t have the fancy charts that marketing or sales teams might want to see.
- No Video Replay: It shows you the code that broke, but it doesn’t show a video of the user’s screen.
- Alert Fatigue: If not set up carefully, it can send too many emails about small, unimportant errors.
- Security & compliance: SOC 2 Type II compliant and very transparent about how they handle user data.
- Support & community: Huge following in the developer world; very easy to find answers on forums like Stack Overflow.
6 — Instabug
Instabug is unique because it focuses on the relationship between the developer and the user. It is famous for its “Shake to Report” feature. If a user finds a bug, they just shake their phone, and Instabug automatically takes a screenshot and sends a report to the developer.
This tool is fantastic for “Beta Testing,” which is the period when you let a small group of people try your app before it is finished. It makes it very easy for non-technical people to give feedback. Instead of trying to explain a bug in an email, they just show the developer exactly what happened.
- Key features:
- In-App Bug Reporting: Users can report issues directly inside the app with screenshots and voice notes.
- Session Replay for Mobile: Captures a video of the user’s screen so you can see the bug in action.
- In-App Surveys: Allows you to ask users questions like “How do you like the new design?” while they are using the app.
- App Launch Tracking: Measures how long it takes for the app to become usable for the customer.
- Network Logging: Records all the internet “conversations” the app had during a session.
- Feature Request Board: Lets users vote on which new features they want you to build next.
- Pros:
- Best for User Feedback: No other tool makes it this easy to talk to your users and hear their problems.
- Speeds Up Testing: Helps your testing team find and report bugs 10 times faster than manual methods.
- Comprehensive Data: Combines technical logs with actual human feedback in one report.
- Cons:
- Larger SDK Size: Adding Instabug can make your app’s file size a bit bigger than other tools.
- Can Be Expensive: The price goes up quickly if you want to use the advanced survey and feedback features.
- Mobile Only: It is built strictly for mobile, so it isn’t the best choice if you need to monitor web or servers too.
- Security & compliance: Offers strong privacy features, including the ability to “blur” sensitive user info in screenshots.
- Support & community: Very well known for having an excellent customer success team that helps you get set up.
7 — Embrace
Embrace is a tool that takes a “collect everything” approach. While most tools only record data when a crash happens, Embrace records every single session from start to finish. This means you can look at any user’s experience, even if their app didn’t crash, to see why they might have been frustrated.
This is extremely helpful for finding “silent errors”—problems that don’t make the app shut down but do make it run very poorly. Embrace is becoming a favorite for mobile-first companies like those in gaming or e-commerce, where every single second of performance translates directly into money.
- Key features:
- 100% Session Data: Records every button tap, network call, and screen change for every user.
- User Timelines: Provides a “story” view of a user’s session, making it easy to see exactly what they did.
- ANR (App Not Responding) Tracking: Specialized tools to fix the “frozen” screen issues that are common on Android.
- Third-Party Monitoring: Shows you if an outside service (like a login or an ad) is slowing down your app.
- Low-Level Device Metrics: Tracks technical details like CPU temperature and disk space.
- Memory Leak Detection: Helps find bugs that make the app use more and more memory until it slows to a crawl.
- Pros:
- No More “I Can’t Reproduce This”: Since it records everything, you never have to guess how a bug happened.
- Mobile-First Design: It was built specifically for mobile apps, so it understands phone-specific problems very well.
- High Resolution: Gives you much more detail about the user’s journey than a basic crash reporter.
- Cons:
- Data Overload: Because it collects so much information, it can take time to sort through everything.
- Not Free: Unlike Firebase, you will have to pay for this tool once your app starts getting popular.
- Dashboard Learning Curve: The timeline view is very powerful but takes a little while to get used to.
- Security & compliance: SOC 2 compliant and takes great care to make sure private user data is not recorded.
- Support & community: Offers very personalized support for its customers and is growing a strong community.
8 — AppDynamics
AppDynamics is a “giant” in the industry, owned by the technology company Cisco. It is designed for massive organizations that need to connect their mobile app performance to their actual business sales. It uses a concept called “Business Transactions” to show exactly how performance affects the bottom line.
For example, AppDynamics can show a manager that “a 2-second delay in the checkout screen caused a 10% drop in sales today.” This makes it a favorite for executives who care more about business results than technical code. It is a very “serious” tool for very large, high-stakes environments.
- Key features:
- Business Transaction Monitoring: Tracks specific goals like “User Signed Up” or “Item Purchased.”
- Automated Baselines: The tool “learns” what a normal day looks like and only alerts you when things are unusual.
- Application Flow Maps: Shows a visual diagram of how data flows through your entire company.
- Infrastructure Visibility: Monitors the actual hardware and cloud servers running your app.
- End-User Experience Monitoring: Tracks both mobile and web users to give a complete view of your brand.
- Code-Level Debugging: Allows engineers to “drill down” into the server code to fix slow responses.
- Pros:
- Connects Tech to Money: It is the best tool for showing bosses how fixing bugs helps the company make more money.
- Extremely Secure: Being a Cisco product, it meets the toughest security standards in the world.
- Complete Coverage: It can monitor every single piece of technology in a large corporation.
- Cons:
- Very Expensive: The cost is often too high for anything other than a large, wealthy company.
- Old-Fashioned UI: Compared to newer startups like Datadog, the interface can feel a bit dated and clunky.
- Complex to Install: Usually requires a team of experts to set up and manage correctly.
- Security & compliance: Fully compliant with ISO, SOC 2, and FedRAMP (for government use).
- Support & community: Global support network with experts available in almost every country.
9 — Raygun
Raygun is a beautifully designed tool that focuses on making performance data easy to understand. It is often described as “Sentry with a prettier face.” It offers a great balance of tracking crashes and monitoring real-time speed, all in a dashboard that is a pleasure to look at.
Raygun is perfect for teams that want high-quality data but don’t want to feel like they are looking at a complex airplane cockpit. It simplifies the data so you can see at a glance if your app is healthy or if you need to take action. It is very popular with medium-sized businesses that value design and simplicity.
- Key features:
- Real-User Monitoring (RUM): Shows you a live map of your users and how fast the app is responding for them.
- Smart Error Grouping: Makes sure you don’t get 1,000 emails for the same single bug.
- User Profiles: Lets you look at a specific person’s history to see if they have been having a bad experience lately.
- Deployment Tracking: Mark exactly when you released a new version to see if it introduced any new problems.
- Performance Comparisons: Compare different versions or different countries to see where the app is slowest.
- Integrations: Connects easily to Slack, Trello, and Jira so your team can stay organized.
- Pros:
- Excellent User Interface: One of the most intuitive and easy-to-use dashboards on the market.
- Quick to Install: You can get the basic monitoring working in just a few minutes.
- Great Value: Offers a lot of high-end features for a price that is much lower than the “enterprise” tools.
- Cons:
- Smaller Ecosystem: Doesn’t have as many third-party plugins as a giant like Google or Datadog.
- Less Server Focus: While it can monitor servers, its real strength is on the “front-end” (what the user sees).
- Basic AI: It doesn’t have the advanced “automatic fixing” AI that a tool like Dynatrace offers.
- Security & compliance: GDPR compliant and SOC 2 certified with strong data protection.
- Support & community: Known for being very responsive to customer emails and having very clear “how-to” guides.
10 — Bugsnag
Bugsnag is a tool that focuses on “Stability.” They believe that the most important number for any app is its “Stability Score”—which is the percentage of user sessions that are crash-free. It helps teams decide: “Should we build new features today, or should we stop and fix the bugs?”
It is a very focused tool that does one thing extremely well: managing and prioritizing crashes. It is used by famous apps like Yelp and Square because it helps them maintain a very high level of quality. It is now part of a larger company called SmartBear, which means it has a lot of resources and stability behind it.
- Key features:
- Stability Score Benchmarks: Shows you how your app compares to other apps in your industry.
- Release Management: A special dashboard just for seeing if a new update is “healthy” enough to stay out.
- Feature Flag Tracking: See if a specific new feature (like a new “Dark Mode”) is causing crashes.
- Intelligent Alerting: Only notifies the person who “owns” that specific part of the code when it breaks.
- Lightweight Mobile SDK: One of the smallest and fastest code packages, so it won’t bloat your app.
- Advanced Search and Filter: Allows you to find crashes that only happen on “Samsung phones with low battery.”
- Pros:
- Focuses the Team: The Stability Score is a great way to get the whole company focused on quality.
- Very Fast: The dashboard is very responsive and helps you find the cause of a bug in seconds.
- Great for Big Teams: Its alerting features make it easy to manage bugs across a team of 100+ developers.
- Cons:
- Limited Speed Tracking: It is much better at tracking crashes than it is at tracking speed or slowness.
- No Session Video: You can’t watch a video of the user; you can only look at the technical logs.
- Can Be Pricey: Once you move past the basic plan, the costs can go up as your team grows.
- Security & compliance: SOC 2 and GDPR compliant; used by many high-security finance companies.
- Support & community: Very active blog and community; excellent documentation for all major mobile languages.
Comparison Table
| Tool Name | Best For | Platform(s) Supported | Standout Feature | Rating |
| Firebase | Startups on a Budget | iOS, Android, Unity | Totally Free Tier | 4.5/5 |
| New Relic | Full-Stack Context | iOS, Android, React | End-to-End Tracing | 4.6/5 |
| Datadog | Visual Debugging | iOS, Android, Flutter | Session Replay Video | 4.5/5 |
| Dynatrace | Large Enterprises | All Mobile & Web | AI Root Cause Finder | 4.6/5 |
| Sentry | Developer Teams | iOS, Android, Hybrid | Line-of-Code Accuracy | 4.5/5 |
| Instabug | Beta Testing | iOS, Android, React | Shake-to-Report | 4.7/5 |
| Embrace | Hard-to-Find Bugs | iOS, Android, Unity | 100% Session Record | 4.4/5 |
| AppDynamics | Business Value | iOS, Android | Revenue Tracking | 4.5/5 |
| Raygun | Simple Dashboards | iOS, Android, Hybrid | Best User Interface | 4.3/5 |
| Bugsnag | App Stability | iOS, Android, Unity | Stability Score | 4.4/5 |
Evaluation & Scoring of Mobile Performance Monitoring Tools
| Category | Weight | Evaluation Criteria |
| Core Features | 25% | Does it track crashes, speed, network, and device battery? |
| Ease of Use | 15% | How simple is it for a new team member to learn? |
| Integrations | 15% | Does it talk to Slack, Jira, GitHub, and your servers? |
| Security | 10% | Does it meet laws like GDPR and have SOC 2 security? |
| Performance | 10% | Is the monitoring tool itself small and fast? |
| Support | 10% | Is there a good community and fast human help? |
| Price / Value | 15% | Is the cost worth the time and money it saves? |
Which Mobile Performance Monitoring Tool Is Right for You?
Selecting a tool is not about finding the “best” one in the world, but finding the one that fits your current needs. Your choice will likely change as your app grows from a small idea into a large business.
Solo Users vs. SMB vs. Mid-Market vs. Enterprise
For Solo Users or Students, Firebase is the only choice that makes sense because it is free and gives you everything you need to start. For Small and Medium Businesses (SMBs), Sentry or Raygun are great because they are affordable and easy to use. Mid-Market companies that need deeper data often choose Datadog or Embrace to get those visual session replays. Finally, Enterprises with huge budgets and strict security rules will usually go with Dynatrace or AppDynamics.
Budget-Conscious vs. Premium Solutions
If you have zero budget, stick with Firebase. If you have a medium budget and want the most “bang for your buck,” Sentry offers a lot of power for a very fair price. If you have a high budget and want the “Ferrari” of monitoring, Datadog or Dynatrace are the premium choices that provide the most advanced features like AI and video replays.
Feature Depth vs. Ease of Use
Some teams want to see every single detail, even if it is complicated. For them, New Relic and Embrace are perfect. Other teams just want to see a simple green or red light to know if the app is working. For those teams, Raygun and Bugsnag are better because their dashboards are much easier to understand at a glance.
Integration and Scalability Needs
If your app is already part of a larger system (like a complex website and server), you need a tool that integrates well across everything. Datadog and New Relic are the best at “Full-Stack” monitoring. If your app is independent and you just want to focus on the mobile experience, Instabug or Embrace are more specialized for that task.
Security and Compliance Requirements
If you are building an app for healthcare, finance, or the government, security is your number one priority. You must choose a tool that is HIPAA or FedRAMP compliant. Dynatrace, AppDynamics, and New Relic have the most experience and the highest certifications for these high-security industries.
Frequently Asked Questions (FAQs)
1. What exactly is a “Mobile Performance Monitoring” tool?
It is a piece of code you add to your app that watches for crashes, slowness, and other errors. It sends this data to a dashboard so you can fix problems before users complain.
2. Does adding a monitoring tool make my app slower?
Almost all modern tools are designed to be “lightweight.” They use very little battery and only send data when the user isn’t busy, so the app stays fast.
3. What is the difference between a “crash” and a “performance issue”?
A crash is when the app completely shuts down. A performance issue is when the app stays open but is very slow, buggy, or hard to use.
4. Can I see what a user is doing on their screen with these tools?
Some tools like Datadog and Instabug offer “Session Replay,” which shows a visual recreation of the screen. However, they usually blur out sensitive info like passwords for privacy.
5. Are there any free tools available?
Yes! Google’s Firebase Performance Monitoring is free for most users. Apple and Google also provide basic, free “vitals” in their respective app stores.
6. Do these tools work on both iPhone and Android?
Yes, all the tools on our top 10 list support both iOS (iPhone) and Android. Many also support hybrid apps like React Native or Flutter.
7. How do I know if I’m getting “Alert Fatigue”?
Alert fatigue is when your tool sends so many emails that you start ignoring them. If this happens, you need to adjust your settings to only alert you for major problems.
8. What is a “Stability Score”?
Popularized by Bugsnag, this is a percentage (like 99.9%) that tells you how many of your user sessions were completely free of crashes.
9. Can these tools help me save money?
Yes. By finding bugs early, you save money on customer support and prevent users from leaving your app for a competitor.
10. Is it hard to set these tools up?
For most modern tools, you just add one or two lines of code. It usually takes less than an hour to start seeing your first bits of data.
Conclusion
Selecting a mobile performance monitoring tool is one of the smartest investments you can make for your app’s future. In a world where users expect everything to work perfectly and instantly, having a “digital doctor” watching over your code is no longer a luxury—it is a necessity. Whether you are a solo developer using Firebase to keep costs low or a large company using Dynatrace to manage a complex system, the goal is always to provide a smooth, fast, and happy experience for the person holding the phone.
The most important thing to remember is that the “best” tool is the one that fits your team’s unique way of working. You don’t need the most expensive features if a simple crash reporter gives you the answers you need to fix your bugs. Focus on a tool that is easy for your developers to use and gives you clear, actionable information. By staying proactive and fixing performance issues before they turn into bad reviews, you will build a loyal user base and a successful mobile business.